
Alteryx Investor Presentation | Interactive
The Alteryx Investor Presentation is showcased as an interactive online document, offering comprehensive information for investors across various industries. By
Investor Presentation Q4

Confidential 2021 Alteryx, Inc. 2 Safe Harbor This presentation includes forward-looking statements within the meaning of the Private Securities Litigation Reform Act of 1995. These forward-looking statements may be identified by the use of terminology such as believe, may, will, intend, expect, plan, anticipate, estimate, potential, or continue, or other comparable terminology. All statements other than statements of historical fact could be deemed forward-looking, including any projections of product availability, growth and financial metrics and any statements regarding product roadmaps, strategies, plans or use cases. Although Alteryx believes that the expectations reflected in any of these forward-looking statements are reasonable, these expectations or any of the forward-looking statements could prove to be incorrect, and actual results or outcomes could differ materially from those projected or assumed in the forward-looking statements, including, but not limited to, as a result of: the impact to the economy, our customers and our business due to the COVID-19 pandemic; our ability to manage our growth and the investments made to grow our business effectively; our ability to retain and expand our talent base, particularly our sales force and software engineers, and increase their productivity; our history of losses; our dependence on our software platform for substantially all of our revenue; our ability to attract new customers and expand sales to and retain existing customers; our ability to develop and release product and service enhancements and new products and services to respond to rapid technological change in a timely and cost-effective manner; intense and increasing competition in our market; the rate of growth in the market for analytics products and services; our ability to establish and maintain successful relationships with our channel partners; our dependence on technology and data licensed to us by third parties; risks associated with our international operations; our ability to develop, maintain, and enhance our brand and reputation cost effectively; litigation and related costs; security breaches; and other general market, political, economic and business conditions. Additionally, these forward-looking statements involve risk, uncertainties and assumptions, including those related to the impact of COVID-19 on our business and global economic conditions. Many of these assumptions relate to matters that are beyond our control and changing rapidly, including, but not limited to, the timeframes for and severity of the impact of COVID-19 on our customers purchasing decisions and the length of our sales cycles, particularly for customers in certain industries highly affected by COVID-19. Alteryxs future financial condition and results of operations, as well as any forward-looking statements, are subject to risks and uncertainties, including but not limited to the factors set forth above, in Alteryxs press releases, public statements and/or filings with the Securities and Exchange Commission, especially the Risk Factors section of Alteryxs most recent Annual Report on Form 10-K. These documents and others containing important disclosures are available at www.sec.gov or in the Investors section of Alteryxs website at www.alteryx.com. All forward-looking statements are made as of the date of this presentation and Alteryx assumes no obligation to update any such forward-looking statements. This presentation also contains estimates and other statistical data made by independent parties and by us relating to market size and growth and other data about our industry. This data involves a number of assumptions and limitations, and you are cautioned not to give undue weight to such estimates. In addition, projections, assumptions, and estimates of our future performance and the future performance of the markets in which we operate are necessarily subject to a high degree of uncertainty and risk. In addition to the financials presented in accordance with U.S. generally accepted accounting principles (GAAP), this presentation includes certain non-GAAP financial measures. The non-GAAP financial measures have limitations as analytical tools and you should not consider them in isolation or as a substitute for the most directly comparable financial measures prepared in accordance with GAAP. There are a number of limitations related to the use of these non-GAAP financial measures versus their nearest GAAP equivalents. Other companies, including companies in our industry, may calculate non-GAAP financial measures differently or may use other measures to evaluate their performance, all of which could reduce the usefulness of our non-GAAP financial measures as tools for comparison. We urge you to review the reconciliation of our non-GAAP financial measures to the most directly comparable GAAP financial measures set forth in the Appendix, and not to rely on any single financial measure to evaluate our business. Any unreleased services or features referenced in this or other presentations, press releases or public statements are only intended to outline Alteryxs general product direction. They are intended for information purposes only and may not be incorporated into any contract. This is not a commitment to deliver any material, code, or functionality (which may not be released on time or at all) and customers should not rely upon this presentation or any such statements to make purchasing decisions. The development, release, and timing of any features or functionality described for Alteryxs products remains at the sole discretion of Alteryx. Alteryx, the Alteryx logo, Alteryx Designer, Alteryx Server, Alteryx Analytics Gallery, Alteryx Connect, Alteryx Promote, Alteryx Analytic Process Automation, Alteryx Analytics Hub, Alteryx Intelligence Suite, Feature Labs, ClearStory Data, Semanta, Yhat, Alteryx ANZ and other registered or common law trade names, trademarks, or service marks of ours appearing in this presentation are our property. The presentation contains additional trade names, trademarks, and service marks of other companies, including, but not limited to, our customers, technology partners, and competitors, that are the property of their respective owners. We do not intend our use or display of other companies' trade names, trademarks, or service marks to imply a relationship with, or endorsement or sponsorship of us by, these other companies.
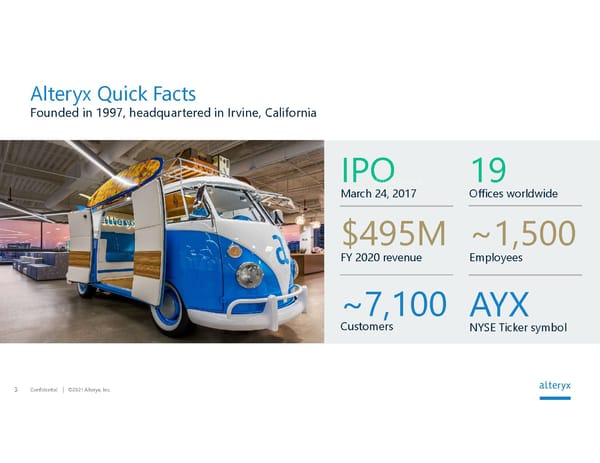
Confidential 2021 Alteryx, Inc. 3 $495M FY 2020 revenue ~1,500 Employees ~7,100 Customers AYX NYSE Ticker symbol IPO March 24, 2017 19 Offices worldwide Alteryx Quick Facts Founded in 1997, headquartered in Irvine, California
.png)
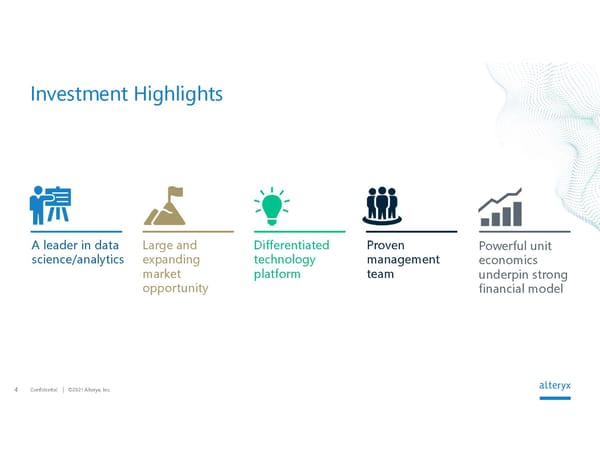
Confidential 2021 Alteryx, Inc. 4 Investment Highlights Differentiated technology platform Proven management team A leader in data science/analytics Large and expanding market opportunity Powerful unit economics underpin strong financial model
Confidential 2021 Alteryx, Inc. 5 Analysts need help with data analytics, but few are satisfied with the results Todays Analyst Tools and Processes Are Insufficient 69% 81% 62% Have to depend on others within their organization to perform at least some steps in the analytic process Are not satisfied with the quality of the final output Are not satisfied with the overall speed of the analytic process Source: Harvard Business Review Analytic Services, Uncovering the Keys to Becoming Truly Analytics-Driven, May 8, 2018.
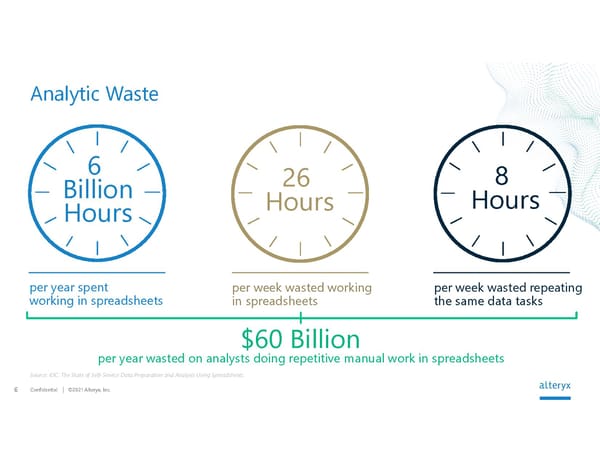
Confidential 2021 Alteryx, Inc. 6 Analytic Waste per year spent working in spreadsheets per week wasted working in spreadsheets per week wasted repeating the same data tasks 6 Billion Hours 26 Hours 8 Hours per year wasted on analysts doing repetitive manual work in spreadsheets $60 Billion Source: IDC: The State of Self-Service Data Preparation and Analysis Using Spreadsheets.
Confidential 2021 Alteryx, Inc. 7 101100101010101011000101010100101010010101001101100101010 101011000101010100101010100101001101100101010101011000101 010100101010100101001101100101010101011000101010110101010 100101001101100101010101011000101010100101010100101001101 100101010101011000101010110101010100101001101100101010101 011000101010100101010100101001101100101010101011000101010 110101010100101001101100101010101011000101010100101010100 101001101100101010101011000101010110101010100101001101100 101010101011000101010100101010100101001101100101010101011 000101010110101010100101001101100101010101011000101010100 101010010101001101100101010101011000101010100101010100101 001101100101010101011000101010100101010100101001101100101 01010101100010101011010101010010100110110010101 101100101010101011000101010100101010010101001101100101010 101011000101010100101010100101001101100101010101011000101 010100101010100101001101100101010101011000101010110101010 100101001101100101010101011000101010100101010100101001101 100101010101011000101010110101010100101001101100101010101 011000101010100101010100101001101100101010101011000101010 110101010100101001101100101010101011000101010100101010100 101001101100101010101011000101010110101010100101001101100 101010101011000101010100101010100101001101100101010101011 000101010110101010100101001101100101010101011000101010100 101010010101001101100101010101011000101010100101010100101 001101100101010101011000101010100101010100101001101100101 01010101100010101011010101010010100110110010101 1011001010101010110001010101001010100101010 0110110010101010101100010101010010101010010 1001101100101010101011000101010100101010100 1010011011001010101010110001010101101010101 0010100110110010101010101100010101010010101 0100101001101100101010101011000101010110101 0101001010011011001010101010110001010101001 0101010010100110110010101010101100010101011 0101010100101001101100101010101011000101010 1001010101001010011011001010101010110001010 1011010101010010100110110010101010101100010 1010100101010100101001101100101010101011000 1010101101010101001010011011001010101010110 0010101010010101001010100110110010101010101 1000101010100101010100101001101100101010101 0110001010101001010101001010011011001010101 0101100010101011010101010010100110110010101 0101011000101010100101010100101001101100101 0101010110001010101101010101001010011011001 The Average Analytical Process Source: IDC, State of Analytics and Data Science (Commissioned by Alteryx), April 2019. 4-7 Tools 6 Inputs 7 Outputs average number of data sources per analytics or data science activity to perform data activities average number target outputs per analytics or data science activity
Confidential 2021 Alteryx, Inc. 8 Alteryx Introduces Analytic Process Automation
This is a modal window.
Confidential 2021 Alteryx, Inc. 9 Key Tenets of a Transformative Platform Brings together data, process and people Automates data-driven business processes Engages via a human- centered experience
Confidential 2021 Alteryx, Inc. 10 Automating processes Upskilling people Digital Transformation Is Underway Democratizing data and analytics
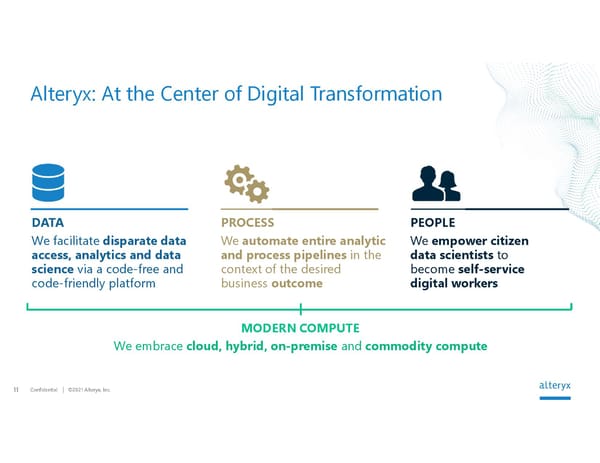
Confidential 2021 Alteryx, Inc. 11 Alteryx: At the Center of Digital Transformation PEOPLE We empower citizen data scientists to become self-service digital workers DATA We facilitate disparate data access, analytics and data science via a code-free and code-friendly platform PROCESS We automate entire analytic and process pipelines in the context of the desired business outcome We embrace cloud, hybrid, on-premise and commodity compute MODERN COMPUTE
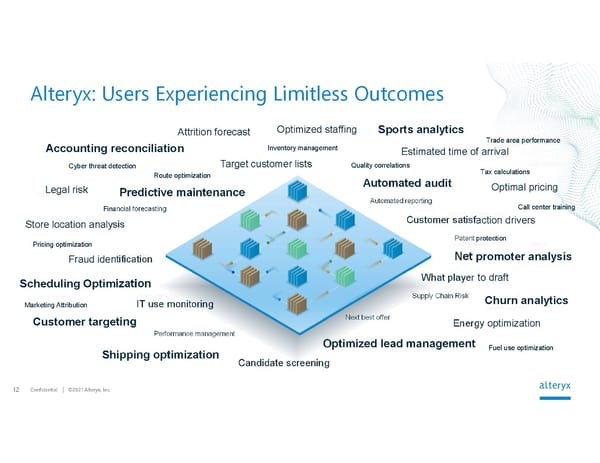
Confidential 2021 Alteryx, Inc. 12 Alteryx: Users Experiencing Limitless Outcomes Financial forecasting Supply Chain Risk Automated reporting Quality correlations Cyber threat detection Marketing Attribution Inventory management Pricing optimization Tax calculations Next best offer Performance management Call center training Route optimization Trade area performance Patent protection IT use monitoring Attrition forecast Fraud identification What player to draft Customer satisfaction drivers Target customer lists Optimized staffing Legal risk Optimal pricing Candidate screening Energy optimization Estimated time of arrival Store location analysis Accounting reconciliation Predictive maintenance Customer targeting Churn analytics Automated audit Optimized lead management Sports analytics Scheduling Optimization Shipping optimization Net promoter analysis Fuel use optimization
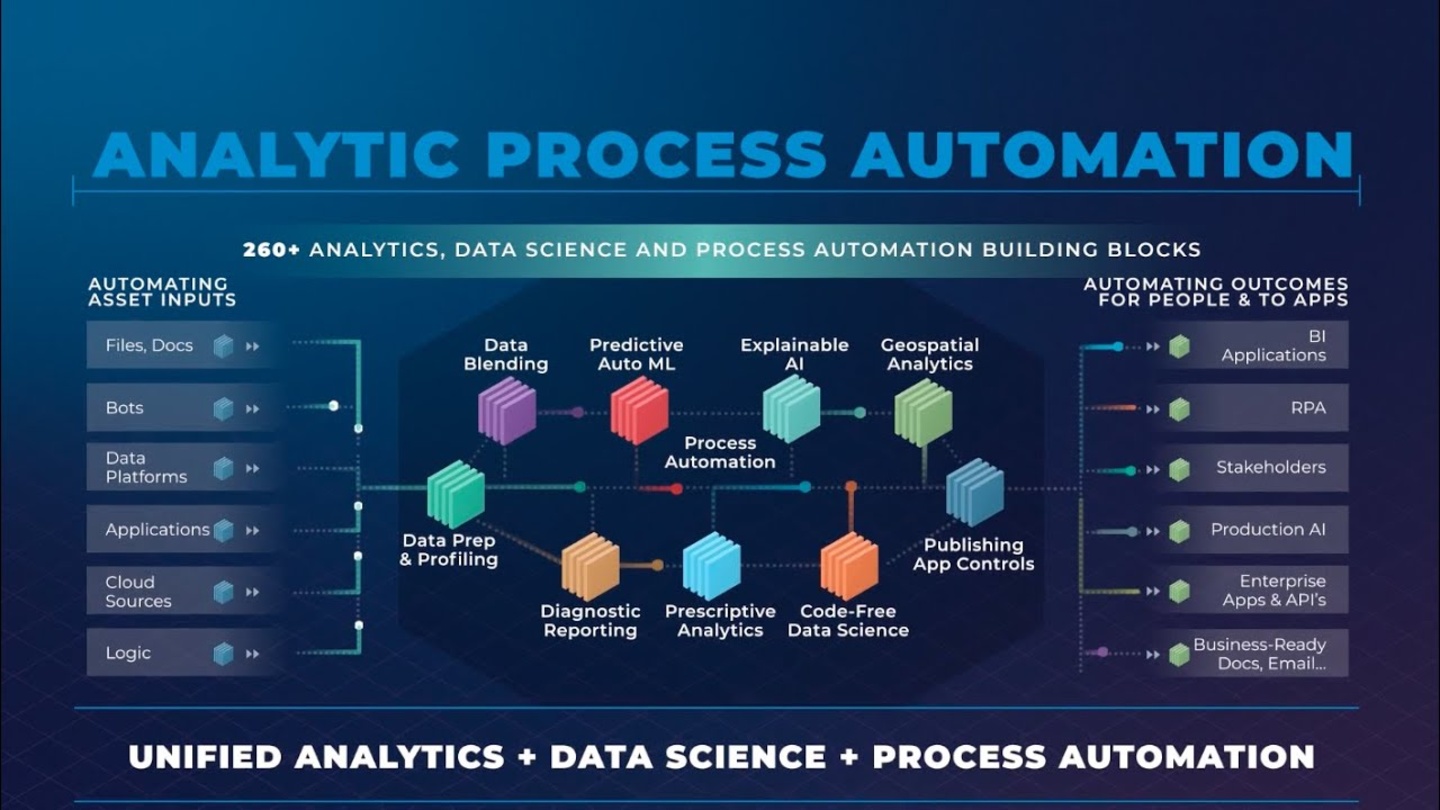
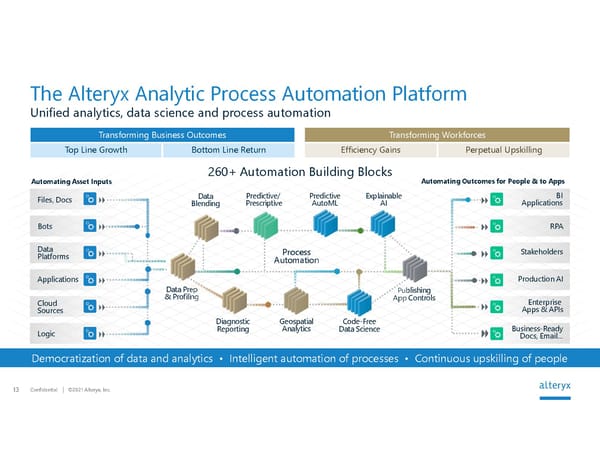
Confidential 2021 Alteryx, Inc. 13 The Alteryx Analytic Process Automation Platform Unified analytics, data science and process automation Cloud Sources Bots Data Platforms Files, Docs Applications Logic Democratization of data and analytics Intelligent automation of processes Continuous upskilling of people BI Applications RPA Stakeholders Business-Ready Docs, Email... Enterprise Apps & APIs Production AI Automating Asset Inputs Automating Outcomes for People & to Apps Data Blending Code-Free Data Science Data Prep & Profiling Diagnostic Reporting Explainable AI Geospatial Analytics Publishing App Controls Predictive AutoML Predictive/ Prescriptive Process Automation Transforming Business Outcomes Top Line Growth Bottom Line Return Transforming Workforces Efficiency Gains Perpetual Upskilling 260+ Automation Building Blocks
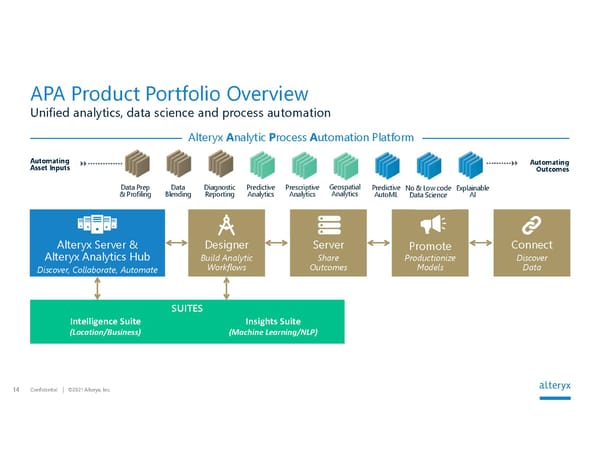
Confidential 2021 Alteryx, Inc. 14 APA Product Portfolio Overview Unified analytics, data science and process automation Data Prep & Profiling Data Blending Prescriptive Analytics No & Low code Data Science Diagnostic Reporting Predictive Analytics Predictive AutoML Alteryx A nalytic P rocess A utomation Platform Geospatial Analytics Explainable AI Alteryx Server & Alteryx Analytics Hub Discover, Collaborate, Automate Automating Asset Inputs Automating Outcomes Designer Build Analytic Workflows Server Share Outcomes Promote Productionize Models Connect Discover Data SUITES Intelligence Suite (Location/Business) Insights Suite (Machine Learning/NLP)
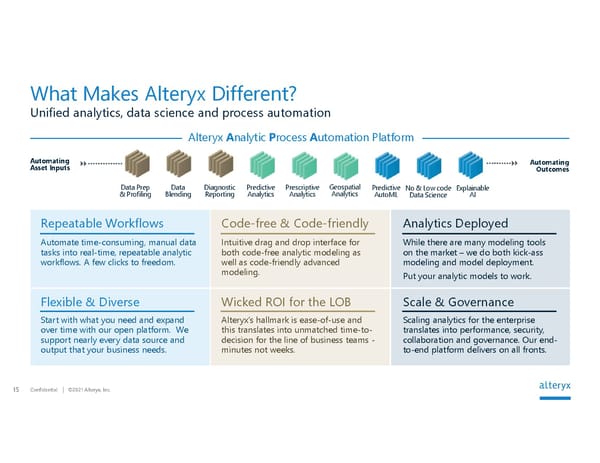
Confidential 2021 Alteryx, Inc. 15 What Makes Alteryx Different? Unified analytics, data science and process automation Data Prep & Profiling Data Blending Prescriptive Analytics No & Low code Data Science Diagnostic Reporting Predictive Analytics Predictive AutoML Alteryx A nalytic P rocess A utomation Platform Geospatial Analytics Explainable AI Automating Asset Inputs Automating Outcomes Repeatable Workflows Analytics Deployed While there are many modeling tools on the market we do both kick-ass modeling and model deployment. Put your analytic models to work. Automate time-consuming, manual data tasks into real-time, repeatable analytic workflows. A few clicks to freedom. Code-free & Code-friendly Intuitive drag and drop interface for both code-free analytic modeling as well as code-friendly advanced modeling. Flexible & Diverse Scale & Governance Scaling analytics for the enterprise translates into performance, security, collaboration and governance. Our end- to-end platform delivers on all fronts. Start with what you need and expand over time with our open platform. We support nearly every data source and output that your business needs. Wicked ROI for the LOB Alteryxs hallmark is ease-of-use and this translates into unmatched time-to- decision for the line of business teams - minutes not weeks.
Confidential 2021 Alteryx, Inc. 16 The network effects of a transformative platform creates a winner-takes-most opportunity.

This is a modal window.
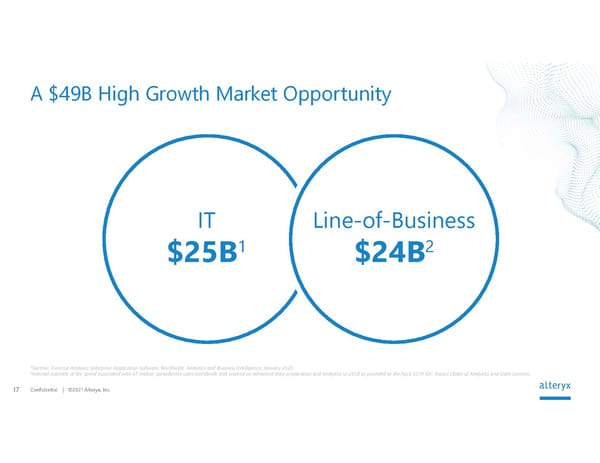
Confidential 2021 Alteryx, Inc. 17 A $49B High Growth Market Opportunity (1) Gartner, Forecast Analysis: Enterprise Application Software, Worldwide , Analytics and Business Intelligence, January 2020. (2) Internal estimate of the spend associated with 47 million spreadsheet users worldwide that worked on advanced data preparation and analytics in 2018 as provided in the April 2019 IDC Report (State of Analytics and Data Science). 1 Gartner, Forecast Analysis: Enterprise Application Software, Worldwide, Analytics and Business Intelligence, January 2020. 2 Internal estimate of the spend associated with 47 million spreadsheet users worldwide that worked on advanced data preparation and analytics in 2018 as provided in the April 2019 IDC Report (State of Analytics and Data Science). IT $25B 1 Line-of-Business $24B 2
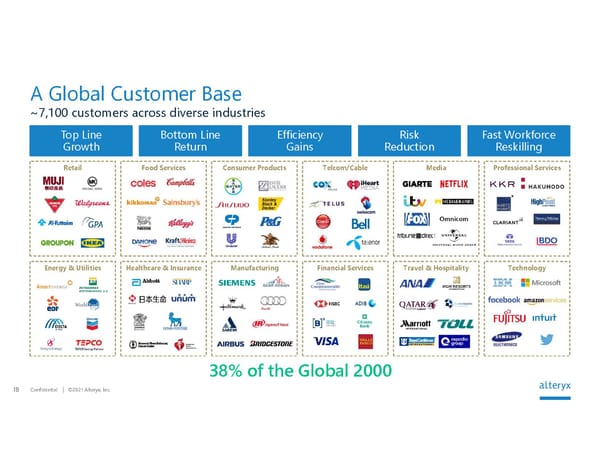
Confidential 2021 Alteryx, Inc. 18 A Global Customer Base ~7,100 customers across diverse industries Retail Top Line Growth Bottom Line Return Efficiency Gains Risk Reduction Fast Workforce Reskilling Food Services Consumer Products Telcom/Cable Media Professional Services Energy & Utilities Healthcare & Insurance Manufacturing Financial Services Travel & Hospitality Technology 38% of the Global 2000
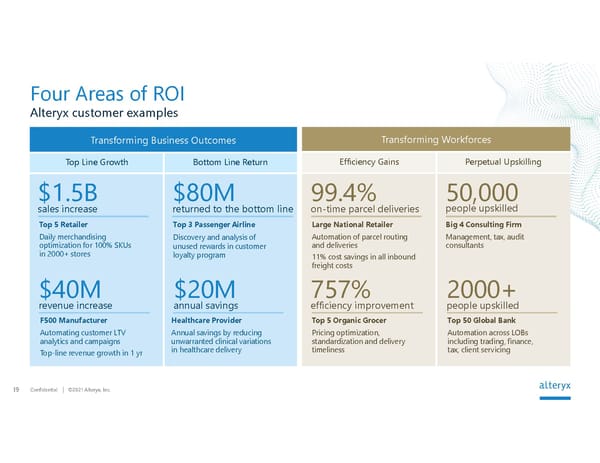
Confidential 2021 Alteryx, Inc. 19 Alteryx customer examples Four Areas of ROI Transforming Business Outcomes Top Line Growth Bottom Line Return Transforming Workforces Efficiency Gains Perpetual Upskilling $1.5B sales increase $40M revenue increase $20M annual savings 99.4% on-time parcel deliveries 757% efficiency improvement 50,000 people upskilled 2000+ people upskilled Healthcare Provider Annual savings by reducing unwarranted clinical variations in healthcare delivery Large National Retailer Automation of parcel routing and deliveries 11% cost savings in all inbound freight costs Top 5 Organic Grocer Pricing optimization, standardization and delivery timeliness Big 4 Consulting Firm Management, tax, audit consultants Top 50 Global Bank Automation across LOBs including trading, finance, tax, client servicing Top 5 Retailer Daily merchandising optimization for 100% SKUs in 2000+ stores F500 Manufacturer Automating customer LTV analytics and campaigns Top-line revenue growth in 1 yr $80M returned to the bottom line Top 3 Passenger Airline Discovery and analysis of unused rewards in customer loyalty program
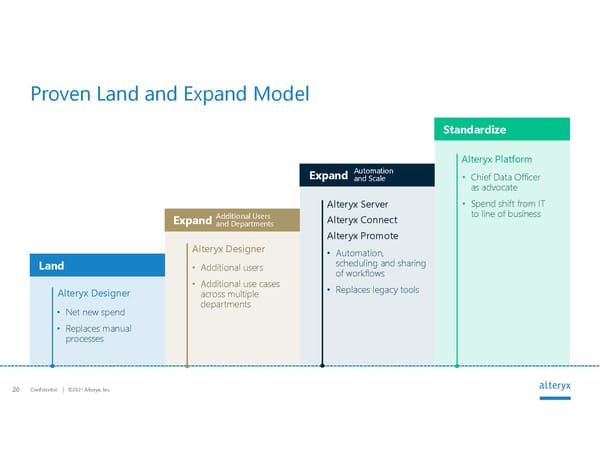
Confidential 2021 Alteryx, Inc. 20 Proven Land and Expand Model Alteryx Designer Net new spend Replaces manual processes Alteryx Designer Additional users Additional use cases across multiple departments Automation, scheduling and sharing of workflows Replaces legacy tools Alteryx Platform Alteryx Server Alteryx Connect Alteryx Promote Chief Data Officer as advocate Spend shift from IT to line of business Land Expand Expand Standardize Additional Users and Departments Automation and Scale
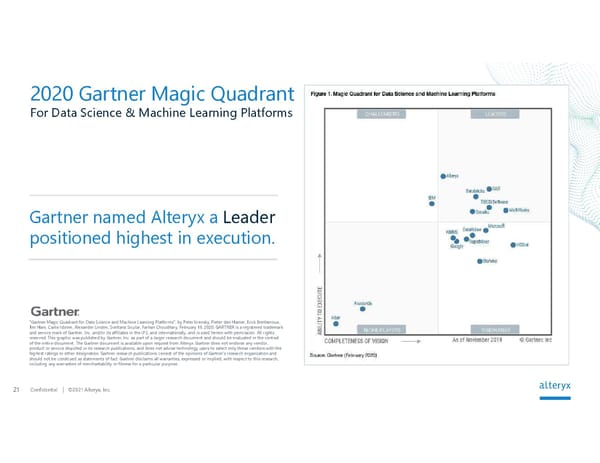
Confidential 2021 Alteryx, Inc. 21 For Data Science & Machine Learning Platforms 2020 Gartner Magic Quadrant Gartner named Alteryx a Leader positioned highest in execution. "Gartner Magic Quadrant for Data Science and Machine Learning Platforms", by Peter Krensky, Pieter den Hamer, Erick Brethenoux, Jim Hare, Carlie Idoine, Alexander Linden, Svetlana Sicular, Farhan Choudhary; February 11, 2020. GARTNER is a registered trademark and service mark of Gartner, Inc. and/or its affiliates in the U.S. and internationally, and is used herein with permission. All rights reserved. This graphic was published by Gartner, Inc. as part of a larger research document and should be evaluated in the context of the entire document. The Gartner document is available upon request from Alteryx. Gartner does not endorse any vendor, product or service depicted in its research publications, and does not advise technology users to select only those vendors with the highest ratings or other designation. Gartner research publications consist of the opinions of Gartner's research organization and should not be construed as statements of fact. Gartner disclaims all warranties, expressed or implied, with respect to this research, including any warranties of merchantability or fitness for a particular purpose.
Confidential 2021 Alteryx, Inc. 22 Analytic Market Landscape Citizen Data Scientist Data Scientist /Quant Knowledge Worker ANALYTIC PROCESS AUTOMATION MATURITY Catalog Preparation Descriptive + Diagnostic Predictive + Prescriptive STAND-ALONE DATA CATALOGS LIGHTWEIGHT DATA PREP OPEN SOURCE TOOLS, LIBRARIES AND DEV LANGUAGES VISUALIZATION DATA SCIENCE AND ML PLATFORMS Persona
Confidential 2021 Alteryx, Inc. 23 Growth Drivers Land & Expand Model International Expansion Channel & Partner EcoSystem Community Expansion & Extension New Products & Solutions
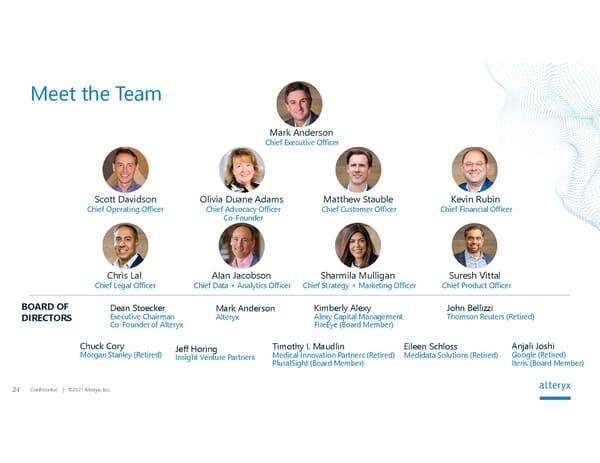
Confidential 2021 Alteryx, Inc. 24 Meet the Team Scott Davidson Chief Operating Officer Matthew Stauble Chief Customer Officer Suresh Vittal Chief Product Officer Mark Anderson Chief Executive Officer Olivia Duane Adams Chief Advocacy Officer Co-Founder Kevin Rubin Chief Financial Officer Chris Lal Chief Legal Officer Alan Jacobson Chief Data + Analytics Officer Sharmila Mulligan Chief Strategy + Marketing Officer Dean Stoecker Executive Chairman Co-Founder of Alteryx Chuck Cory Morgan Stanley (Retired) Kimberly Alexy Alexy Capital Management FireEye (Board Member) John Bellizzi Thomson Reuters (Retired) Mark Anderson Alteryx Timothy I. Maudlin Medical Innovation Partners (Retired) PluralSight (Board Member) Eileen Schloss Medidata Solutions (Retired) Jeff Horing Insight Venture Partners BOARD OF DIRECTORS Anjali Joshi Google (Retired) Iteris (Board Member)
Confidential 2021 Alteryx, Inc. 25 Financial Overview
Confidential 2021 Alteryx, Inc. 26 FYE December 31 | $ in millions Financial Highlights $76 $82 $103 $156 $109 $96 $130 $161 Q 1 1 9 Q 2 1 9 Q 3 1 9 Q 4 1 9 Q 1 2 0 Q 2 2 0 Q 3 2 0 Q 4 2 0 $132 $254 $418 $495 2 0 1 7 2 0 1 8 2 0 1 9 2 0 2 0 QUARTERLY REVENUE ANNUAL REVENUE 1 19% FY 2020 revenue growth 2 122% Dollar-based net expansion rate 4 16% FY 2020 non-GAAP operating margin 3 93% FY 2020 non-GAAP gross margin 3 32% FY 2020 annual recurring revenue growth 2 1 Alteryx adopted the new revenue recognition accounting standard Accounting Standards Codification (ASC) 606 effective January 1, 2018 on a modified retrospective basis. Financial results for the reporting periods during 2018 are presented in accordance with the new revenue recognition standard. Historical financial results for the reporting periods prior to 2018 are presented in conformity with amounts previously disclosed under the prior revenue recognition standard ASC 605. 2 Revenue and annual recurring revenue growth represents FY 2020 Y/Y growth. 3 See the Appendix for a reconciliation between GAAP and non-GAAP financial measures. 4 Represents dollar-based net expansion rate for the three months ended December 31, 2020. See the Appendix for more information.
Confidential 2021 Alteryx, Inc. 27 Annual Recurring Revenue (ARR) $282 $307 $326 $373 $405 $432 $450 $493 Q1 19 Q2 19 Q3 19 Q4 19 Q1 20 Q2 20 Q3 20 Q4 20 +32% year-over-year Note: Please refer to the Appendix of this presentation for definition of ARR.
Confidential 2021 Alteryx, Inc. 28 Margin Profile Non-GAAP % of revenue 1 FY 2017 FY 2018 2 FY 2019 2 FY 2020 2 Three months ended Dec 31, 2020 Three months ended Dec 31, 2019 Gross Margin 85% 92% 92% 93% 94% 93% Research and Development 21% 16% 15% 17% 13% 11% Sales and Marketing 49% 41% 43% 45% 38% 37% General and Administrative 20% 16% 16% 15% 13% 12% Operating Margin (5%) 19% 18% 16% 31% 33% 1 See the Appendix for a reconciliation of GAAP to non-GAAP financial measures. 2 Alteryx adopted the new revenue recognition accounting standard Accounting Standards Codification (ASC) 606 effective January 1, 2018 on a modified retrospective basis. Financial results for the reporting periods during 2018 and 2019 are presented in accordance with the new revenue recognition standard. Historical financial results for the reporting periods prior to 2018 are presented in conformity with amounts previously disclosed under the prior revenue recognition standard ASC 605.
Confidential 2021 Alteryx, Inc. 29 Strong Unit Economics Underpin Powerful Financial Model 1 See the Appendix for a reconciliation of GAAP to non-GAAP financial measures. 2 Alteryx adopted the new revenue recognition accounting standard Accounting Standards Codification (ASC) 606 effective January 1, 2018 on a modified retrospective basis. Financial results for the reporting periods during 2018 and 2019 are presented in accordance with the new revenue recognition standard. Historical financial results for the reporting periods prior to 2018 are presented in conformity with amounts previously disclosed under the prior revenue recognition standard ASC 605. Non-GAAP % of revenue 1 2017 2018 2 2019 2 2020 2 Gross Margin 85% 92% 92% 93% Research and Development 21% 16% 15% 17% Sales and Marketing 49% 41% 43% 45% General and Administrative 20% 16% 16% 15% Operating Margin (5%) 19% 18% 16% Free Cash Flow Margin 12% 8% 5% 10% Drivers Long Term Target Sustained levels 90%-92% Continued innovation 15%-17% Balanced growth 28%-30% Economies of scale 9%-11% Scale and efficiency 35%-40% Economies of scale 30%-35% Target Operating Margin
Confidential 2021 Alteryx, Inc. 30 Appendix
Confidential 2021 Alteryx, Inc. 31 Definitions Annual Recurring Revenue (ARR): ARR represents the annualized recurring value of all active subscription contracts at the end of a reporting period and excludes the value of non-recurring revenue streams, such as professional services. Both multi-year contracts and contracts with terms less than one year are annualized by dividing the total committed contract value by the number of months in the subscription term and then multiplying by twelve. Dollar-Based Net Expansion Rate: Our dollar-based net expansion rate is a trailing four-quarter average of the annual contract value, or ACV, which is defined as the subscription revenue that we would contractually expect to recognize over the term of the contract divided by the term of the contract, in years, from a cohort of customers in a quarter as compared to the same quarter in the prior year. A dollar- based net expansion rate equal to 100% would generally imply that we received the same amount of ACV from our cohort of customers in the current quarter as we did in the same quarter of the prior year. A dollar-based net expansion rate less than 100% would generally imply that we received less ACV from our cohort of customers in the current quarter than we did in the same quarter of the prior year. A dollar- based net expansion rate greater than 100% would generally imply that we received more ACV from our cohort of customers in the current quarter than we did in the same quarter of the prior year. To calculate our dollar-based net expansion rate, we first identify a cohort of customers, or the Base Customers, in a particular quarter, or the Base Quarter. A customer will not be considered a Base Customer unless such customer has an active subscription on the last day of the Base Quarter. We then divide the ACV in the same quarter of the subsequent year attributable to the Base Customers, or the Comparison Quarter, including Base Customers from which we no longer derive ACV in the Comparison Quarter, by the ACV attributable to those Base Customers in the Base Quarter. Our dollar-based net expansion rate in a particular quarter is then obtained by averaging the result from that particular quarter by the corresponding result from each of the prior three quarters. The dollar-based net expansion rate excludes contract value relating to professional services from that cohort. Customer: A customer at the end of any particular period is defined as an entity with a subscription agreement that runs through the current or future period as of the measurement date. A single organization with separate subsidiaries, segments, or divisions that use our platform may represent multiple customers, as we treat each entity that is invoiced separately as a single customer.
Confidential 2021 Alteryx, Inc. 32 Financial results starting in 2018 are presented in accordance with the revenue recognition standard ASC 606. Historical financial results for the reporting periods prior to 2018 are presented in conformity with amounts previously disclosed under the prior revenue recognition standard ASC 605. Prior to the adoption of ASC 606 effective January 1, 2018, revenue was generally recognized ratably over the life of the contract. Under ASC 606, typically 35% to 40% of Total Contract Value (TCV) is recognized up front and the remainder is recognized ratably over the remainder of the contract life. The majority of Alteryxs product offerings are on-premise software solutions and our contracts typically contain multiple performance obligations. As a result, a portion of revenue is recognized up front and a portion is recognized over the life of the contract. Our contracts typically range from one to three years and are billed annually in advance. Dollar-weighted contract duration is approximately 2 years. ASC 606 Revenue Mechanics for AYX
Confidential 2021 Alteryx, Inc. 33 Definitions Subscription-based software license revenue Recognized at the beginning of the subscription term or when the platform is made available to the customer (whichever is later). This is approximately 35%-40% of TCV. Post-contract support (PCS) revenue Represents the portion of revenue that is recognized ratably over the life of the contract. This is the remaining 60% to 65% of TCV. Services revenue Recognized at a point in time as the services are performed and represents 5% or less of total revenue for all periods presented. Annual recurring revenue (ARR) ARR represents the annualized recurring value of all active subscription contracts at the end of a reporting period and excludes the value of non-recurring revenue streams, such as professional services. Both multi-year contracts and contracts with terms less than one year are annualized by dividing the total committed contract value by the number of months in the subscription term and then multiplying by twelve. Deferred revenue Represents contractual amounts invoiced but not yet recognized as revenue. Contract asset Represents unbilled amounts for which the amount of revenue recognized exceeds the amount invoiced. Remaining performance obligations (RPO) Represents the amount of contractual obligations that have not been recognized as revenue.
Confidential 2021 Alteryx, Inc. 34 Deal terms Total contract value (TCV): $300 Duration: 3 years Start date: July 1, Year 1 Invoicing: annually in advance Revenue recognition assumption: 35% upfront, 65% ratable over contract term Revenue recognition commences : July 1, Year 1 An Example Year 1 Year 2 Year 3 Year 4 Subscription-based software license revenue $105 $0 $0 $0 Post-contract support (PCS) revenue $32.5 (6 mos) $65 $65 $32.5 (6 mos) Invoicing $100 $100 $100 $0 Deferred revenue $0 $0 $32.5 $0 Contract asset $37.5 $2.5 $0 $0 Remaining performance obligations $162.5 $97.5 $32.5 $0 ARR at end of year $100 $100 $100 $0 Year 1 Year 2 Year 3 Year 4 Revenue Invoicing Note: This example assumes there is no renewal at the end of the contract term
Confidential 2021 Alteryx, Inc. 35 $ in thousands GAAP to Non-GAAP Reconciliations Q1 2018 Q2 2018 Q3 2018 Q4 2018 Q1 2019 Q2 2019 Q3 2019 Q4 2019 Q1 2020 Q2 2020 Q3 2020 Q4 2020 GAAP income (loss) from operations $2,683 $(3,425) $9,394 $21,118 $(4,402) $(8,288) $11,936 $38,735 $(20,105) $(17,794) $9,633 $24,359 Stock-based compensation 3,789 3,894 4,382 4,582 5,335 8,024 8,836 10,930 13,664 16,923 20,697 23,632 Amortization of intangible assets 477 517 518 517 505 1,152 1,181 1,184 1,168 812 829 1,161 Change in fair value of contingent consideration 293 162 - 169 - (75) - 175 - - - - Intangible asset impairment - - - - - - - - 2,025 - - - Non-GAAP income (loss) from operations $7,242 $1,148 $14,294 $26,386 $1,438 $813 $21,953 $51,024 $(3,248) $(59) $31,159 $49,152 As margin % Total revenue $50,329 $51,502 $62,589 $89,150 $76,020 $82,043 $103,397 $156,450 $108,831 $96,233 $129,717 $160,527 GAAP operating margin 5% (7%) 15% 24% (6%) (10%) 12% 25% (18%) (18%) 7% 15% Non-GAAP operating margin 14% 2% 23% 30% 2% 1% 21% 33% (3%) (0%) 24% 31%
Confidential 2021 Alteryx, Inc. 36 $ in thousands GAAP to Non-GAAP Reconciliations Q1 2018 Q2 2018 Q3 2018 Q4 2018 Q1 2019 Q2 2019 Q3 2019 Q4 2019 Q1 2020 Q2 2020 Q3 2020 Q4 2020 GAAP gross profit $45,325 $46,233 $56,779 $82,433 $68,020 $72,748 $93,752 $144,239 $95,784 $86,598 $119,303 $149,784 Stock-based compensation 139 206 226 226 307 410 431 486 436 597 714 803 Amortization of intangible assets 446 451 456 456 446 1,096 1,128 1,131 1,118 762 773 1,105 Impairment of intangible assets - - - - - - - - 2,025 - - - Non-GAAP gross profit $45,910 $46,890 $57,461 $83,115 $68,773 $74,254 $95,311 $145,856 $99,363 $87,957 $120,790 $151,692 As margin % Total revenue $50,329 $51,502 $62,589 $89,150 $76,020 $82,043 $103,397 $156,450 $108,831 $96,233 $129,717 $160,527 GAAP gross margin 90% 90% 91% 92% 89% 89% 91% 92% 88% 90% 92% 93% Non-GAAP gross margin 91% 91% 92% 93% 90% 91% 92% 93% 91% 91% 93% 94%
Confidential 2021 Alteryx, Inc. 37 FYE December 31 | $ in thousands GAAP to Non-GAAP Reconciliations 2017 2018 1 2019 1 2020 1 GAAP income (loss) from operations $(18,199) $29,770 $37,981 $(3,907) Stock-based compensation 8,941 16,647 33,125 74,916 Amortization of intangible assets 1,225 2,030 4,022 3,970 Follow-on public offering costs 676 - - - Change in fair value of contingent consideration 190 624 100 - Impairment of intangible assets 2,025 Non-GAAP income (loss) from operations $(7,167) $49,071 $75,228 $77,004 As margin % Total revenue $131,607 $253,570 $417,910 $495,308 GAAP operating margin (14%) 12% 9% (1%) Non-GAAP operating margin (5%) 19% 18% 16% ASC 605 ASC 606 1 Alteryx adopted the new revenue recognition accounting standard Accounting Standards Codification (ASC) 606 effective January 1, 2018 on a modified retrospective basis. Financial results for the 2018 and 2019 reporting periods are presented in accordance with the new revenue recognition standard. Historical financial results for the reporting periods prior to 2018 are presented in conformity with amounts previously disclosed under the prior revenue recognition standard ASC 605.
Confidential 2021 Alteryx, Inc. 38 FYE December 31 | $ in thousands GAAP to Non-GAAP Reconciliations 2017 2018 1 2019 1 2020 1 GAAP gross profit $109,804 $230,770 $378,759 $451,469 Stock-based compensation 485 797 1,634 2,550 Amortization of intangible assets 1,213 1,809 3,801 3,758 Impairment of intangible assets 2,025 Non-GAAP gross profit $111,502 $233,376 $384,194 $459,802 As margin % Total revenue $131,607 $253,570 $417,910 $495,308 GAAP gross margin 83% 91% 91% 91% Non-GAAP gross margin 85% 92% 92% 93% ASC 605 ASC 606 1 Alteryx adopted the new revenue recognition accounting standard Accounting Standards Codification (ASC) 606 effective January 1, 2018 on a modified retrospective basis. Financial results for the 2018 and 2019 reporting periods are presented in accordance with the new revenue recognition standard. Historical financial results for the reporting periods prior to 2018 are presented in conformity with amounts previously disclosed under the prior revenue recognition standard ASC 605.
Confidential 2021 Alteryx, Inc. 39 FYE December 31 | $ in thousands GAAP to Non-GAAP Reconciliations 2017 2018 1 2019 1 2020 1 Three months ended Dec 31, 2020 1 Three months ended Dec 31, 2019 1 GAAP research & development expense $29,342 $43,449 $69,100 $101,117 $26,448 $20,892 Stock-based compensation (1,635) (3,699) (6,954) $(18,388) (5,973) (2,940) Non-GAAP research & development expense $27,707 $39,750 $62,146 $82,729 $20,475 $17,952 As margin % Total revenue $131,607 $253,570 $417,910 $495,308 $160,527 $156,450 GAAP research & development 22% 17% 17% 20% 16% 13% Non-GAAP research & development 21% 16% 15% 17% 13% 11% ASC 605 ASC 606 1 Alteryx adopted the new revenue recognition accounting standard Accounting Standards Codification (ASC) 606 effective January 1, 2018 on a modified retrospective basis. Financial results for the 2018 and 2019 reporting periods are presented in accordance with the new revenue recognition standard. Historical financial results for the reporting periods prior to 2018 are presented in conformity with amounts previously disclosed under the prior revenue recognition standard ASC 605.
Confidential 2021 Alteryx, Inc. 40 FYE December 31 | $ in thousands GAAP to Non-GAAP Reconciliations 2017 2018 1 2019 1 2020 1 Three months ended Dec 31, 2020 1 Three months ended Dec 31, 2019 1 GAAP sales & marketing expense $66,420 $109,284 $191,735 $252,820 $68,794 $61,321 Stock-based compensation (2,302) (6,153) (12,659) (28,463) (8,030) (3,837) Amortization of intangible assets (12) (221) (221) (211) (55) (53) Non-GAAP sales & marketing expense $64,106 $102,910 $178,855 $224,146 $60,709 $57,431 As margin % Total revenue $131,607 $253,570 $417,910 $495,308 $160,527 $156,450 GAAP sales & marketing expense 50% 43% 46% 51% 43% 39% Non-GAAP sales & marketing expense 49% 41% 43% 45% 38% 37% ASC 605 ASC 606 1 Alteryx adopted the new revenue recognition accounting standard Accounting Standards Codification (ASC) 606 effective January 1, 2018 on a modified retrospective basis. Financial results for the 2018 and 2019 reporting periods are presented in accordance with the new revenue recognition standard. Historical financial results for the reporting periods prior to 2018 are presented in conformity with amounts previously disclosed under the prior revenue recognition standard ASC 605.
Confidential 2021 Alteryx, Inc. 41 FYE December 31 | $ in thousands GAAP to Non-GAAP Reconciliations 2017 2018 1 2019 1 2020 1 Three months ended Dec 31, 2020 1 Three months ended Dec 31, 2019 1 GAAP general & administrative expense $32,241 $48,267 $79,943 $101,439 $30,183 $23,291 Stock-based compensation (4,519) (5,998) (11,878) (25,515) (8,826) (3,667) Follow-on-public offering costs (676) - - - - - Change in fair value of contingent consideration (190) (624) (100) - - (175) Non-GAAP general & administrative expense $26,856 $41,645 $67,965 $75,924 $21,537 $19,449 As margin % Total revenue $131,607 $253,570 $417,910 $495,308 $160,527 $156,450 GAAP general & administrative 24% 19% 19% 20% 19% 15% Non-GAAP general & administrative 20% 16% 16% 15% 13% 12% ASC 605 ASC 606 1 Alteryx adopted the new revenue recognition accounting standard Accounting Standards Codification (ASC) 606 effective January 1, 2018 on a modified retrospective basis. Financial results for the 2018 and 2019 reporting periods are presented in accordance with the new revenue recognition standard. Historical financial results for the reporting periods prior to 2018 are presented in conformity with amounts previously disclosed under the prior revenue recognition standard ASC 605.
Confidential 2021 Alteryx, Inc. 42 FYE December 31 | $ in thousands GAAP to Non-GAAP Reconciliations 2017 2018 1 2019 1 2020 1 GAAP cash flow from operations $18,943 $26,089 $34,192 $74,782 Less: purchases of property and equipment $(3,669) $(6,728) $(11,453) $(26,358) Free cash flow $15,274 $19,361 $22,739 $48,424 As margin % Total revenue $131,607 $253,570 $417,910 $495,308 GAAP cash flow from operations 14% 10% 8% 15% Free cash flow 12% 8% 5% 10% ASC 605 ASC 606 1 Alteryx adopted the new revenue recognition accounting standard Accounting Standards Codification (ASC) 606 effective January 1, 2018 on a modified retrospective basis. Financial results for the 2018 and 2019 reporting periods are presented in accordance with the new revenue recognition standard. Historical financial results for the reporting periods prior to 2018 are presented in conformity with amounts previously disclosed under the prior revenue recognition standard ASC 605.
Confidential 2021 Alteryx, Inc. Thank you alteryx.com